In the next few posts, we are going to talk about growth analytics, growth accounting, and how to forecast growth.
Check out the other posts that I have written if you haven’t
1500+ people have subscribed to the growth catalyst newsletter so far. To receive the newsletter weekly in your email, consider subscribing 👇
If you aren’t familiar with the newsletter and online sessions, you can read about it here
Off to the topic,
We have been taught the lesson that more is better since childhood. So we try to apply the same when we start working with data.
We start with dissecting data in all sorts of ways and add it to dashboards/ spreadsheets. There are all kinds of good intentions, and we end up introducing ‘top 20 metrics’ for a simple product. The ratio of noise keeps increasing until there is data fatigue. People get overwhelmed with these dashboards and they end up putting lesser use of these dashboards.
Data overload is a real thing. Don’t believe me? Search ‘data puke’ on Google. This is what you get
How do you say goodbye to data overload? By putting everything in a logical order and cutting out the noise. Data should always tell a coherent story, whether it is present in dashboards or spreadsheets.
A story is always easy to understand and remember. Good for us that all of data/growth analytics can be summed into three logical steps:
Start with understanding how users are using your product. This step helps you focus on which steps are important and what % of users are completing those steps.
Divide your users into different groups based on their traits and behaviour. Repeat step 1 for these groups to find which groups are finding your product useful and which aren’t.
Track the behavior of users over time.
Let’s start with step 1
How users are using your product?
Whether you have launched a new product or have just joined a startup/company, the quickest and most effective way to understand key metrics is to understand product usage.
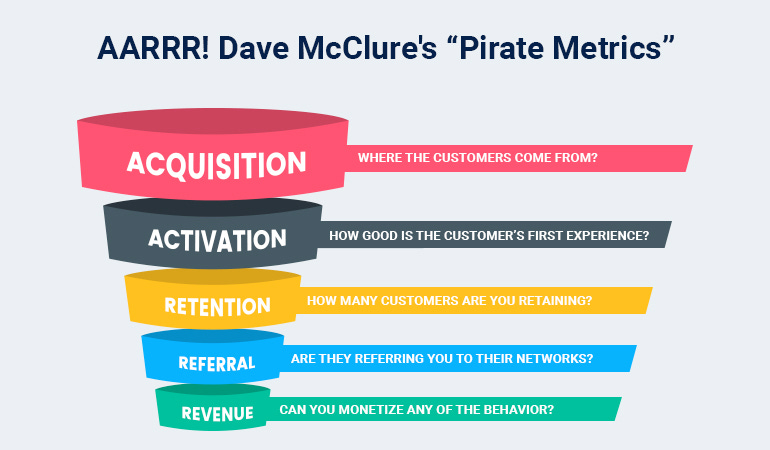
As there are 100s of events that users do on the website/app, it is humanly impossible to go through all kinds of analysis. The user flows also vary from product to product. Now you may ask, is there a universal way to analyze product usage? Yes, there is one. The best framework I have found so far is AARRR, also known as pirate metrics. Here are the different steps of AARRR.
(A)cquisition — # of users coming to your product. This could be on any page - home page, category page, product page.
(A)ctivation — # of users doing meaningful action(s). For eCommerce, this could be searching a product, or visiting a product page. For social media, this could be adding friends.
(R)etention — Does the user come back again? As we have already mentioned in earlier posts, retention is a leading indicator of product-market fit.
(R)evenue — Revenue is a synonym for conversion. Revenue can come through multiple ways: product purchase, in-app purchase, ads.
(R)eferral — Does the existing user brings more users? We covered referrals extensively in the last post. Now we know that referral is an acquisition channel, so why give it a different space in this framework? Share/referral is the only channel that can lead to exponential growth, i.e. scales non-linearly. It is very different from other channels of acquisition.
This generic framework helps you understand the usage of the product, and figure out the avenues of growth. AARRR can also be called a conversion funnel because the # of users in each subsequent step reduces. Your goal to convert the maximum % of users to revenue.
The image below will help you understand it better and remember it. Please note that the growth drivers and metrics change for every product.
A note on funnels
AARRR is really useful for the whole product. A lot of you might be owning a part of the product. Funnels are really useful in even analyzing smaller parts of the product. Suppose you are looking at checkout experience for an eCommerce platform. The funnel that you will be looking at is this one.
You can see 70% of users dropping off between shipping and billing. Now, you can try to figure out why it’s happening. And the next thing you have to do to figure out why it’s happening is to ‘divide your users into different groups based on their traits and behavior’
Divide your users into different groups based on their traits and behavior
The formal term for dividing your users into different groups based on their traits and behaviour is called segmentation.
Traits of a user can be the device, browser, geographic location, etc. Behavior is what they do on your website/app. Users coming to your website or app have different traits and behaviors. Some users have iPhones whereas others have android devices. Some spend 30 mins every day, whereas others come only once a week.
How does segmentation help?
If you are lucky, you may find a segment that is converting very low compared to other segments. Now you can address this problem by
building hypothesis on why that is happening, talking to the users in this segment to validate the hypothesis and gain insights
act on the insights to improve conversion
It is important to spend significant time on segmentation because it helps you identify a loyal group of users and target similar users. This in turn can improve your metrics significantly.
Segmentation also helps you identify groups for which the product doesn’t work and either improve it for those groups or stop targeting them.
From the checkout example, if you do segmentation analysis, you may found that this is just happening on iPhone devices. What do you do next? You check whether it’s a recent behavior by analyzing cohorts.
Cohort analysis
A cohort is a group of people with a shared characteristic. For growth, a cohort is a group of users who performed certain actions (such as made a purchase or downloaded your app) within a certain period of time in the past (Dec’19 for example).
For example, all the users who signed up for the first time in Dec’19 can be called the ‘Dec’19 new user cohort’. All the users who purchased something in Dec’19 can be called the ‘Dec’19 customer cohort’.
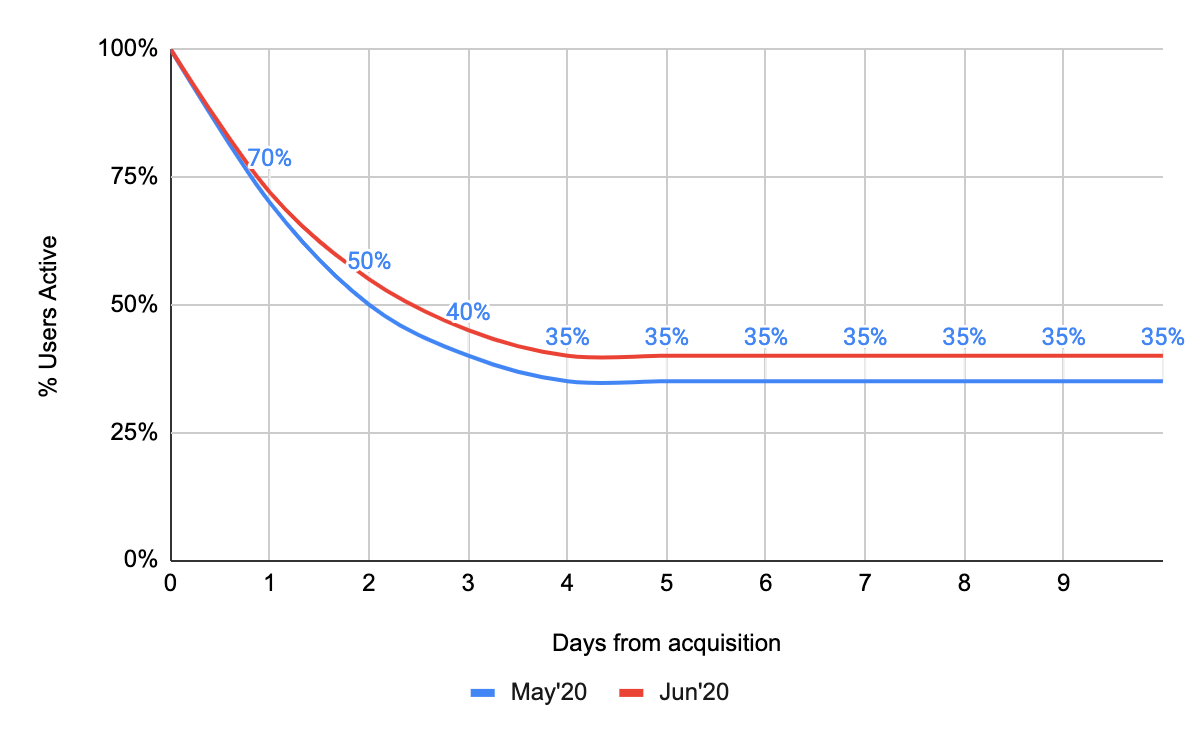
Why do we need cohort analysis? Because over time, you are going to change your product experience and other things. Cohort analysis helps you understand whether you are moving in the right direction or wrong direction. As we covered in this post over PMF
If you are doing something right, over time the retention curves should start moving upward like shown in the picture below.
You should look at the retention curve for different cohorts, weekly or monthly.
How does cohort analysis help you?
Understanding the behavior of users over time can help in calculating LTV and creating revenue/growth projections. For example, you can look at the users who joined the product 12 months back, and how much they have spent in the last 12 months. This gives you a sense of how much money does a new user spends in the first year. Once you have this data, you can take the # of users who joined last month and multiple it by average spend to get revenues for the next 1 year or so.
In the last section of this post, we are going to cover how to find the right tools for growth analytics.
From the checkout example, you may found that the drop-off between shipping and billing has been this high since the last 2 weeks on iPhone. 2 weeks ago, the team released a new app version. You also get to know that there was some work done on the billing page. You work with software devs to finally figure out that on the Safari browser, which is almost exclusively used on iPhones, there is a bug because of which users aren’t able to load the billing page.
Finding the right tools
I have been using product/growth analytics tools for the last 6 years. Over time, I have evaluated many tools. If you are wondering, which tool to use for your product, here is a simple framework to use. It really comes down to 3 things:
The cost you are willing to incur
The volume of data (# of monthly active users, # of events)
How well the tool does funnel, segmentation, and cohort analysis?
Most useful tools in no particular order — Google Analytics, Amplitude, Clevertap, Heap Analytics, Mixplanel, Localytics, Adobe Omniture.
If the volume of data is low, a lot of these tools discussed below are free (up to 10 million events per month). You can check the respective websites to know more about how pricing varies with the volume of data.
Google Analytics is a good starter tool for many products as it’s free and very easy to implement. It also provides user-level insights like age, gender, demographics which isn’t available in other tools.
But if you want strong funnel, segmentation and cohort analytics capabilities, this is the order you should go for
Amplitude > Clevertap/Heap Analytics > Localytics/Mixplanel > Adobe Omniture > Google Analytics.
Should you build in-house analytics capabilities?
Unless you are going to spend > $200 k per year in the next 2 years, you shouldn’t consider building in-house analytics. It takes a good team of data engineers and data analysts to build, maintain, and upgrade your in-house analytics. It also takes 6-12 months to build the first usable version.
So keep cost and time to build in mind while making this decision.
What everyone on your growth team should know?
Everyone on your growth team (PMs, Marketers, Senior leaders) should be comfortable with using your analytics tool of choice. They should also be taking a training/formal course in spreadsheet or excel! I see so many brilliant minds wasting lots of time because they aren’t aware of the powerful capabilities of excel/spreadsheets. The entire finance and consulting industry runs on the top of excel/spreadsheets and they are the ones who do a lot of number crunching, why shouldn’t you learn it and use it then.
There are multiple sources of learning spreadsheet/excel and it only a takes couple of weekends. So if you haven’t done it yet, do it next when you have time :)
That would be all for this week. We will discuss how to define the north metric next week, along with ‘what not to do’ in data analytics. Message me if you have any questions or suggestions to improve this newsletter :)
Subscribe to receive weekly posts in your inbox.
Sincerely,
Deepak


Nice content.Get Grammarly.
Nice article, Deepak. It's very interesting to see how Growth analytics and cohort analysis helps us.