If you know the enemy and know yourself, you need not fear the result of a hundred battles. If you know yourself but not the enemy, for every victory gained you will also suffer a defeat. If you know neither the enemy nor yourself, you will succumb in every battle.
― Sun Tzu, The Art of War
“What’s with the quote, Deepak?” You might ask. Well, you would have to wait till the end to figure this out 😉
Join 700+ subscribers to receive the weekly newsletter in your inbox.
Last week, we discussed how to measure product-market fit and how retention is the best indicators of the PMF. If you are anything like me, your next question is - so I know my numbers, how do I build towards product-market fit? or I don’t have retention numbers because I haven’t launched yet. What do I do in this case? The answer is ‘it depends’ on the stage of your product. Let me explain.
Product-market fit (PMF) is a moving target for founders/PMs because of couple of reasons. One, the market and customer behaviour is constantly changing. Two, once you have satisfied a particular segment of customer (TG) you want to explore more segments to increase your market size and hence have to chase PMF in that segment.
Which is why, while writing about how to build towards PMF, I had to cover the major stages of a product - prelaunch, early stage (0-1 yr), late stage (1 yr+). This made the essay longer than I expected (my first essay with 2000+ words, yay! 🔥 ).
Building PMF Pre-launch
Before launching the product, it is very difficult to test the market for PMF. The major reason is you don’t have a lot of data at your hand. So any conversation of product development should start with
Who is the exact customer (TG) I am trying to serve?
What is the problem you are trying to solve?
What can I offer them that is better than the alternatives? There are different versions of this same question , but it usually refers to usefulness of product.
The most common mistake we do in answering #1 is going too broad in TG definition.#2 is often skipped because we jump directly to #3. And the blunder we do in answering #3 is assuming we know what will make the product useful to the end customer. Now everyone who has worked in product development knows this, however we still don’t do it. The best way to approach these questions is to follow a framework that will force you to avoid these blunders.
Ready for a step-by-step framework you can remember easily and implement to answer the two questions listed above and find PMF?
Rahul Vohra, founder of Superhuman wrote this piece on how he built a systematic approach to find product-market fit before launch. I shared this article in Week #1 newsletter and it’s okay if you haven’t read it yet, the 6-step method outlined below covers the approach along with some additions to make it more specific and actionable. I 💖mnemonics, they help me remember things. The mnemonic for this approach is SATISFY.
(S) Survey
Conduct survey with your current TG/market which consist of the following questions
How would you feel if you could no longer use <X>?
A) Very disappointed
B) Somewhat disappointed
C) Not disappointedWhat type of people do you think would most benefit from <X>?
What is the main benefit you receive from <X>?
How can we improve <X> for you?
Key things to remember while conducting the survey
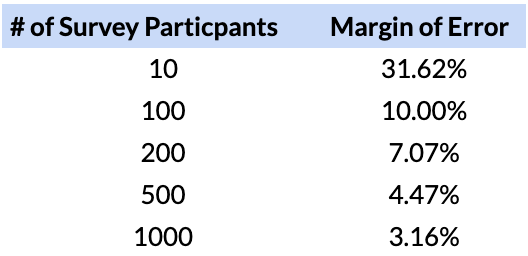
a) You should find large # of people participating in your survey. So the question becomes how high should be # of participants (N)? As a rule of thumb, the margin of error in concluding anything from this survey, is ~1/root(N). Here is a table for a better visualisation.
So you should get at least 100-200 responses. The higher # of participants, the lower the margin of error.
b) A variation of this survey is NPS (net promoter score) where you change the first question to : ”How likely are you to recommend this product to someone? On a scale of 1 to 10”. You can read more about NPS survey in the article section provided at the end.
(A) Analyse
Analyse survey responses to find out what percent of your TG loves your product (‘very disappointed’ bucket)? To reach PMF in a particular TG, you should try to get 40%+ of survey participants into ‘very disappointed’ bucket. If more than 40% of people in your TG are in the ‘very disappointed’ bucket, you can launch and start putting money to grow your product. You can use the % of users in your TG who fall into ‘very disappointed’ bucket as a north metric to track PMF.
(T) Type
What type of people love your product? Look at the responses of Q2 for people who would be ‘very disappointed’. In Q2, people are going to reveal themselves. They will tell you who would your product is going to be useful for. This can help you define your TG crisply.
(I) Ignore
Ignore people who don’t care about your product (not disappointed). This is counterintuitive but it’s a waste of time and energy to convince people to think otherwise who don’t find your product useful at all. Taking out this group would also improve your north metric for PMF.
(S) Sell
Sell the features listed in Q4. Change landing pages of your product to craft a clear message.
(F) Features
Build features requested by people on the fence, i.e. slightly disappointed. Focus on their answer to Q4 of the survey to answer what features you can build for this group to improve the product for them.
(Y) Young
Keep the data Young. What I mean to say is keep doing this with new set of users every week, month, quarter. If you do it once, and then just keep building - it will not be effective.
As Rahul Vohra wrote in the post,
As time went on, we constantly surveyed new users to track how our product/market fit score was changing. We were careful to ensure that we didn’t survey same users more than once.
The percent of users who answered “very disappointed” quickly became our most important number. It was our most highly visible metric, and we tracked it on a weekly, monthly and quarterly basis.
Early Stage (0-1 yr)
For early stage products, in addition to the approach mentioned above (SATISFY), you also have quantitative data coming in through web/app analytics tools, e.g. Mixpanel, Google Analytics.
As mentioned in the last post, the metric we want to look for is retention. Please note that retention is a good measure for majority of tech products because the same user comes back frequently on the platform to perform an action.
When the actions on your platforms by users isn’t frequent like house purchase or online degree, another lens to look through is CAC:LTV ratio for PMF. [CAC - customer acquisition cost, LTV - life time value]
There are four key things to do:
1.Measure retention at the right granularity
By granularity I mean - daily, weekly, monthly. The level of granularity at which you should you tracking it depends on the frequency of usage of your product based on user needs. Here are some examples
Social media and communication apps like FB, Instagram, WeChat - People need to use them Daily
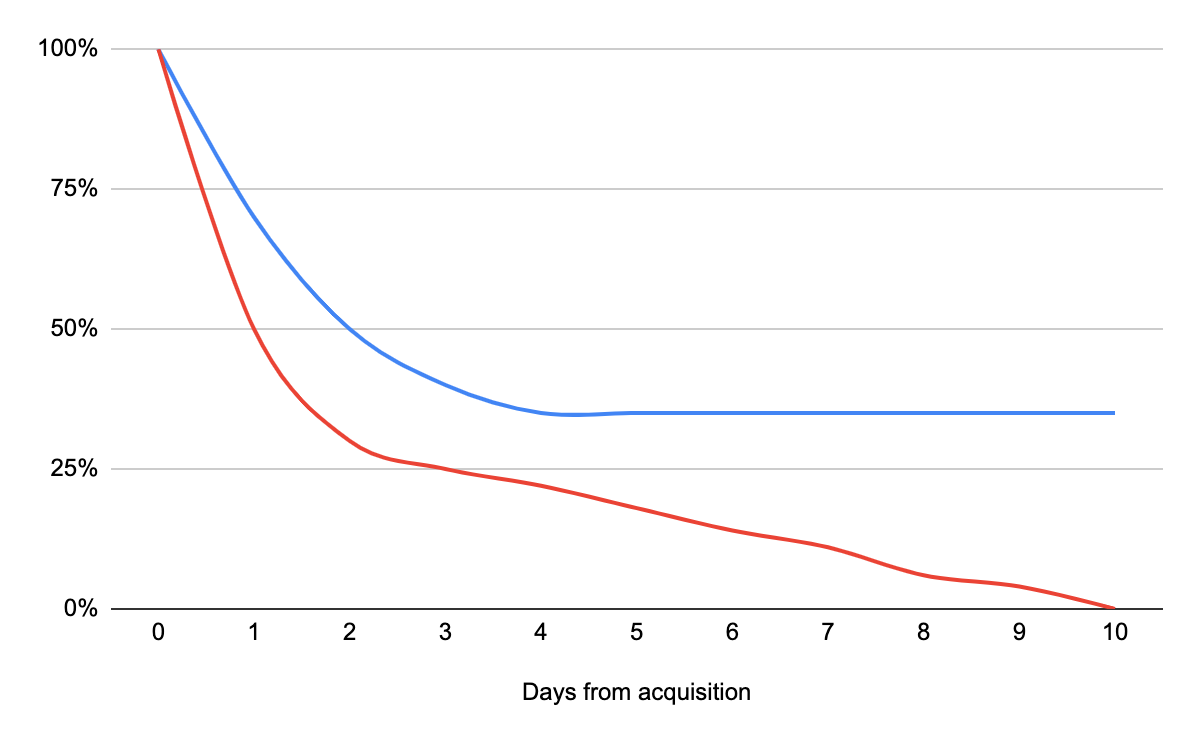
For a product to grow, the retention curve should flatten at some point just like the blue line curve in the picture below. In absence of curve flattening, all the user you gained will get out of your system at some point. As you can see in the red line, you would lose all users you acquired today in next 10 days. The product displaying the red line behavior doesn’t have product-market fit.
Pro Tip
Do not try to grow product by acquiring a lot of customers if the retention curve doesn’t flatten. This story of 1mg from Mint illustrates this point
Another company that has done well here is 1mg. After starting out as an e-pharmacy in 2015, the company realized that in order to organize the Indian healthcare market, which has not been designed keeping the end consumer in mind, it needs to provide a one-stop patient-care tech platform.
1mg quickly added e-consultation and e-diagnostics services. Becoming an integrated platform early on allowed the firm to reduce its dependence on discounting for consumer acquisition and retention. This has led to improved margins as the company scaled up. 1mg has been able to reduce its customer acquisition cost to less than 17% of gross merchandise volume (GMV) in an industry where it is generally more than 25%.
As it often happens, a competitor - Practo followed the same model.
2.Behavioural segmentation to identify sticky segments
This is similar to the way you segmented while analysing the survey. Modern tools like Amplitude and Clevertap give an option to see retention curves for different segments based on user attributes (age, gender, device etc.) as well as user behavior (actions performed on the platform). It is important to identify:
Who are the people sticking with you and who is leaving the platform early?
Are the people sticking with the product doing certain actions that others aren’t?
Facebook’s Chamath Palihapitiya famously found that if they could get a user to “7 friends in 10 days”, they were much more likely to be retained on the platform. They focus heavily on this insight by introducing features like ‘People you may know’.
Slack, similarly discovered
“Based on experience of which companies stuck with us and which didn't, we decided that any team that has exchanged 2,000 messages in its history has tried Slack — really tried it. For a team around 50 people that means about 10 hours’ worth of messages. For a typical team of 10 people, that’s maybe a week’s worth of messages. But it hit us that, regardless of any other factor, after 2,000 messages, 93% of those customers are still using Slack today.”
- Stewart Butterfield, Founder of Slack
Such segmentation makes sure that you are able to narrow down your TG quantitatively (‘very disappointed’ bucket) and target more of such customers. The insights are very useful in scaling the product.
3. Periodic assessment of retention curves
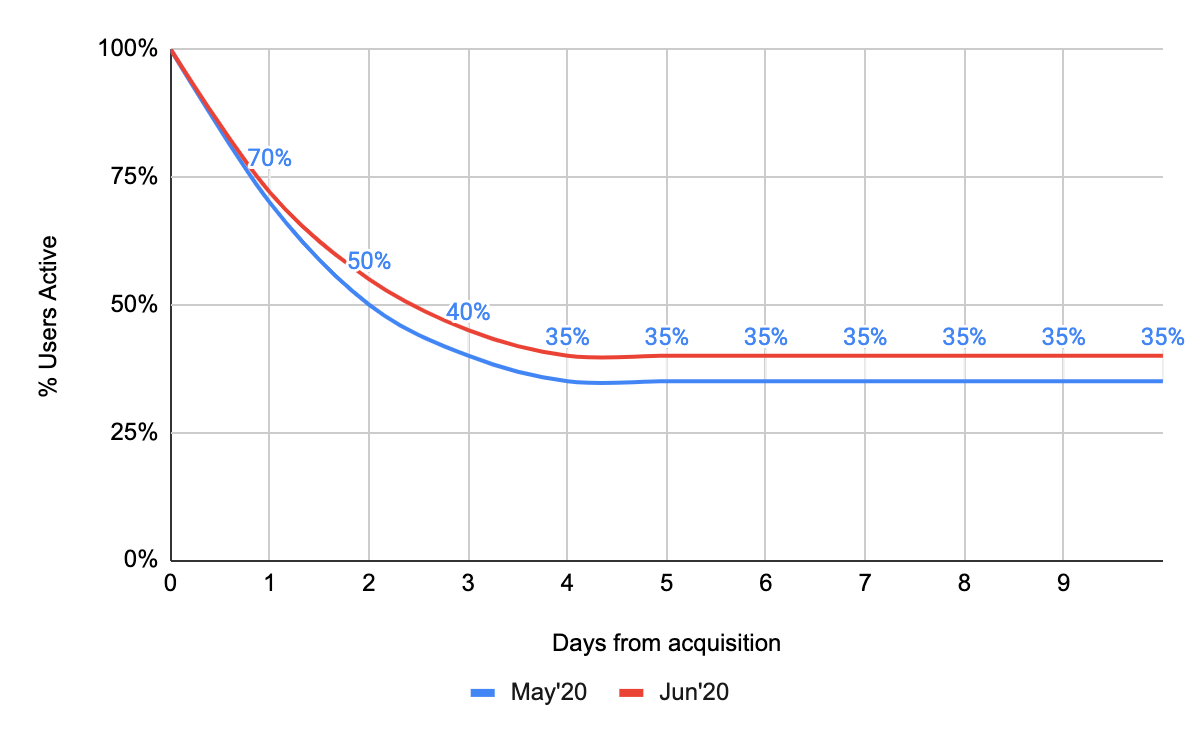
If you are doing something right, over time the retention curves should start moving upward like shown in the picture below.
You should look at the retention curve for different cohorts, weekly or monthly.
4. CAC:LTV ratio
CAC:LTV ratio should be looked closely for businesses where there is no recurring revenue. As a rule of thumb, CAC:LTV ratio should be 1:3 to build a sustainable business.
Say, you run a portal which offers online degrees like upGrad, Udacity or Coursera. Now, a single user would come to your platform and pay for the degree one-time only because most people take no more than 1-2 online degrees in their career. So if the upfront customer acquisition cost is higher than the amount paid for online degree, you are operating the business at a loss and it wouldn’t be sustainable in a long run. This is one of the reasons why companies like Coursera have moved to a cheaper but longer monthly subscription model. The subscription model ensures that a user can keep paying for learning and continuously upgrading themselves.
Late stage PMF (1 yr+)
It might so happen that even for a stable product with a flattening retention curve earlier, retention starts going down due to some changes in market and consumer trends. In that case, you should consider using all the frameworks mentioned here to figure out what to build.
If you still haven’t got a good retention curve, it’s time to give yourself a reality check on
Market - does the market exists?
TG - have you defined the customers well?
Usefulness of the product - what % of your TG would be very disappointed to not use your product?
Probably revisit whether you should sunset the product or pivot.
This would be all for this week. I have added many links to good articles in this newsletter at different places and you should go through them. Not sharing extra articles to go through since it has been a long read!
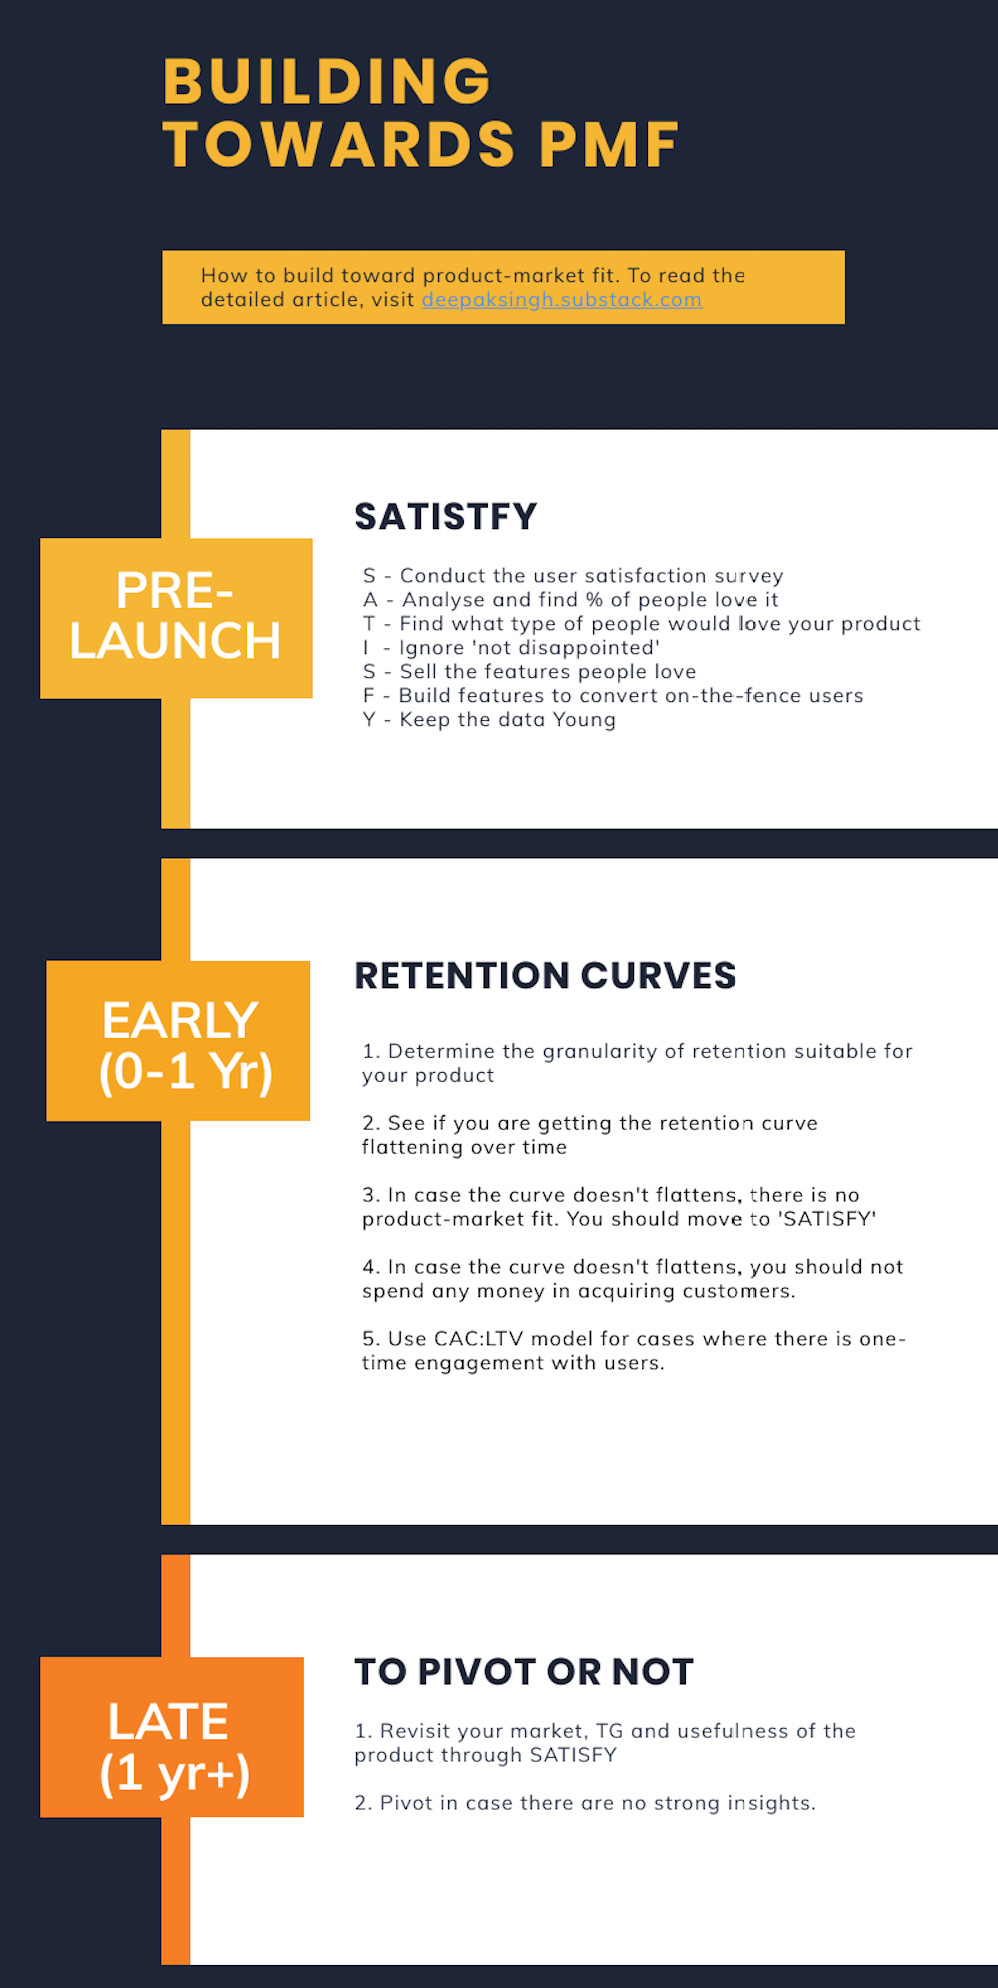
Here is a infographic to remember it all. Feel free to share it with your friends :)
The quote at the beginning of this newsletter can now be modified as the following:
If you know the market and know customer, you need not fear the result of a hundred launches. If you know the market but not the customer, for every successful launch you will also suffer a defeat. If you know neither the market nor the customer, you will succumb in every launch.
― Deepak Singh, The Art of Product Development.
Just kidding 😉
Hopefully, you are satisfied with the newsletter so far. Time for a survey, please fill it HERE.
Subscribe here to receive the newsletter in your inbox every week.
Thanks,
Deepak


Wow, really a beautiful blog on PMF. Very good framework to validate at every stage.
Great essay, I have a doubt regarding survey's, first question, How would you feel if you could no longer use X, does X refer to our idea ? Or some other product similar to what we are building.