AI Product Management Series: Measuring Performance in Supervised Learning Models
👋 Hey, I am Deepak and welcome to another edition of my newsletter. I deep dive into topics around building products and driving growth.
For the new ones here, do check out the popular posts that I have written recently if you haven’t
10,000+ smart, curious folks have subscribed to the growth catalyst newsletter so far. To receive the newsletter weekly in your email, consider subscribing 👇
Let’s dive in the topic now!
In the realm of product management and entrepreneurship, leveraging machine learning models has become increasingly prevalent. In the last post, we looked into PM’s role in AI models, supervised models, subtypes of supervised models, and how they work. In this post, we will talk about how to measure performance of supervised models!
Note that this post is also supplemented with a video where I talk about everything in this post in more detail wherever required. It gets easier to explain certain concepts that way, hence I am taking a hybrid approach. Here is the video :)
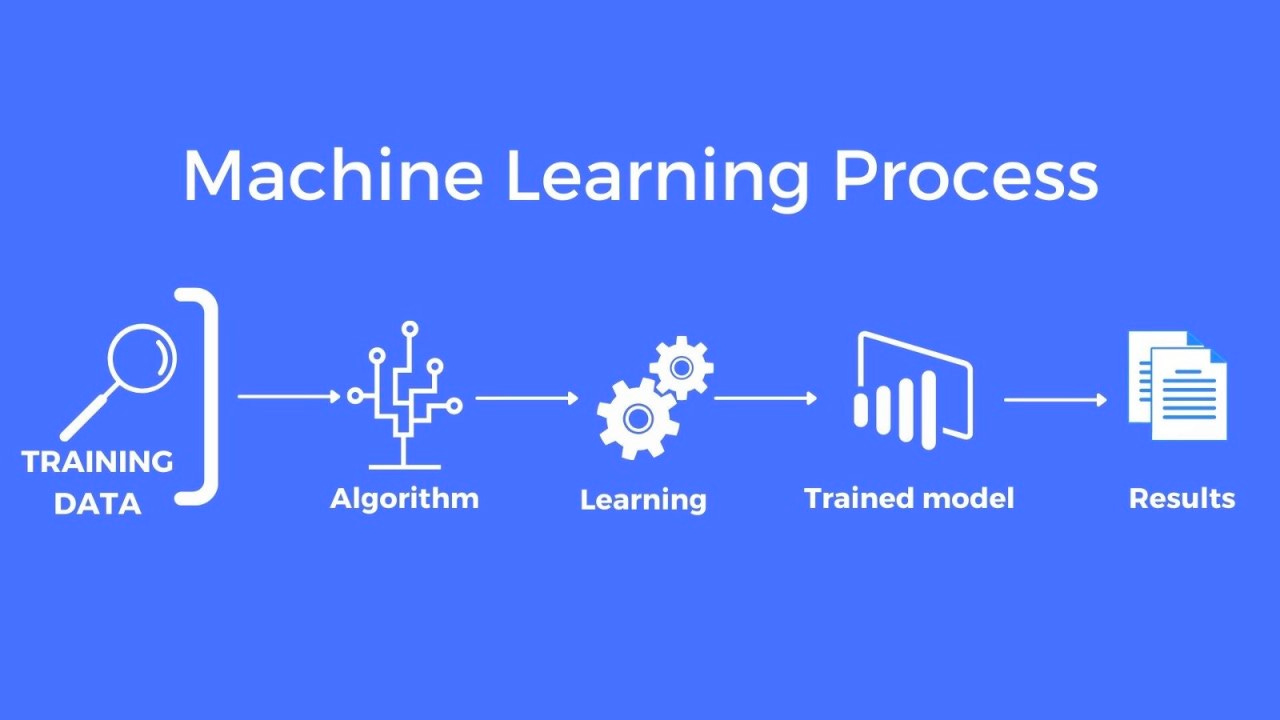
Let’s recap the fundamental components of the machine learning process:
training data,
algorithm,
a trained model,
and the subsequent results.
As we covered in the last post, AI product managers have an important role in two steps: creating the training data and measuring the performance of the model. Understanding how to measure performance of these models is important for PMs. Once you understand performance well, you can map it back to changes in training data required. We will cover the mapping in a future post.
Let’s get into the performance of supervised models.
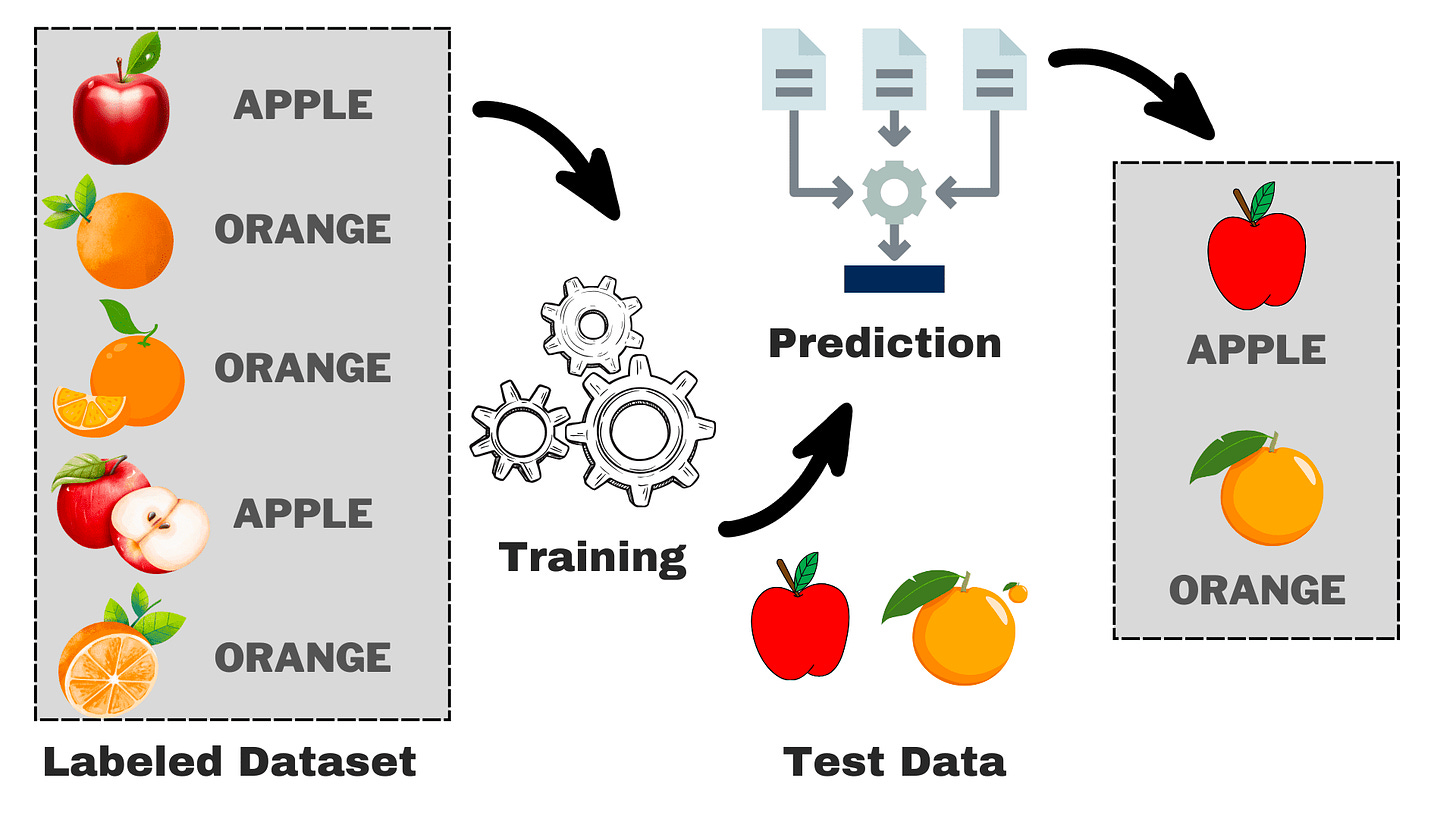
Supervised models utilize labeled datasets for training. For instance, in a classification supervised model that distinguishes between images of apples and oranges, the labels are "apple" or "orange." Once trained, these models can predict labels for new data.
We can assessing the efficacy of these models by looking at how accurate the classification is for the set of images we provide. This process of providing new set of images is called Testing the model.
Subsets of Labeled Data
Testing the models requires systematic evaluation. The evaluation starts by dividing the whole labeled data into three parts — training, validation, and test.
The training subset is used to train the various algorithms DS team feel can be useful
The validation subset aids in selecting the most effective model
The test subset evaluates the performance of the best model
It goes without saying that how we measure performance is useful in both validation and test sub-sets. Performance evaluation using validation subset helps in narrowing down to the right algo/model. Performance evaluation using test set helps us evaluate how good is the right model, and whether it can be deployed in production for the end users to experience.
So let’s look into how to quantify the performance of the regression models! It should be noted that the approach is different for regression and classification models because they work in quite different ways.
Performance in Regression Models
Regression models predict continuous values, such as housing prices. Two primary metrics, R-squared and Root Mean Squared Error (RMSE), are commonly employed to check the difference between predicted and actual values.
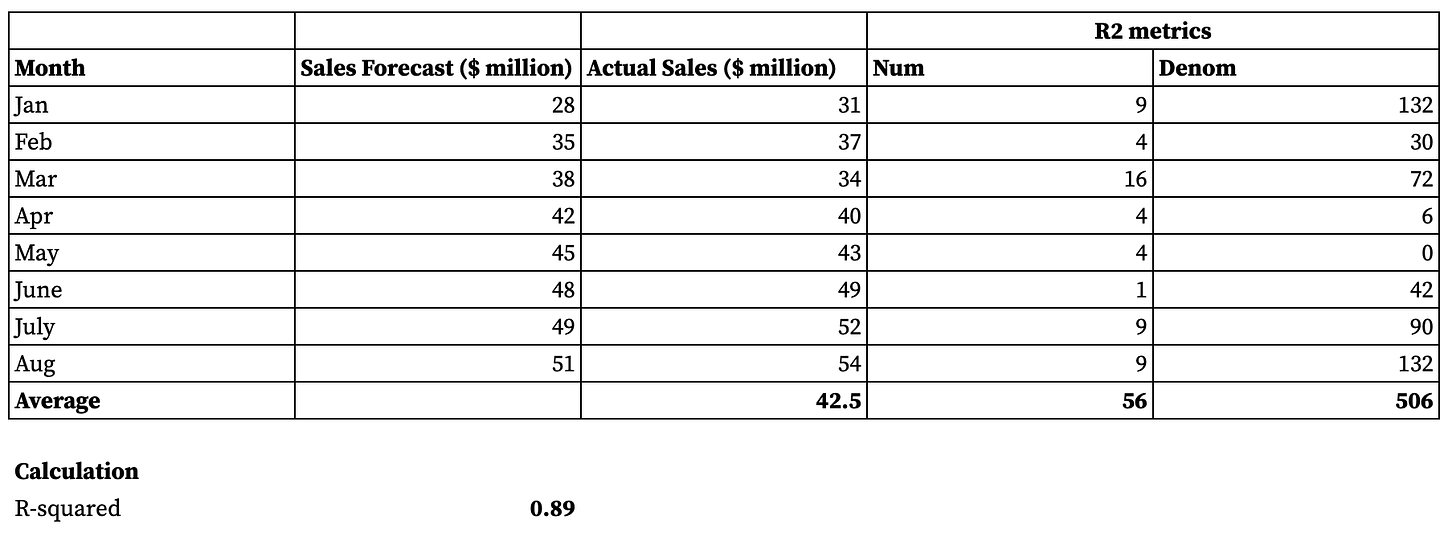
R-squared provides values between 0 to 1, and closer to 1 indicates better performance. R-squared less than 0.4 is considered weak.
Here is the datasheet and sample calculations.
Conversely, RMSE quantifies the average magnitude of errors, and is a absolute measure of deviation.
You can see the RMSE calculations in the same datasheet.
How good or bad RMSE is, can be defined relative to the magnitude of input and output. For example, RMSE of 2 when the input varies between 1 to 10, can mean up to 20% error. But RMSE of 2 when the input varies between 1 to 100, can mean just 2% error. This is where the judgement of PMs come into picture. They can decide which error rate is okay based on the user experience or in the business context.
Performance in Classification Models
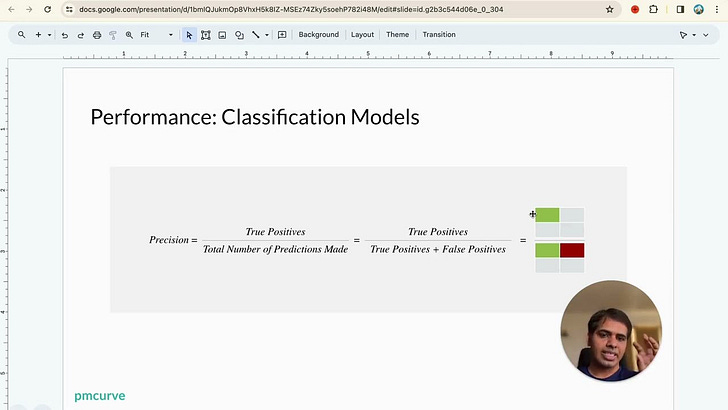
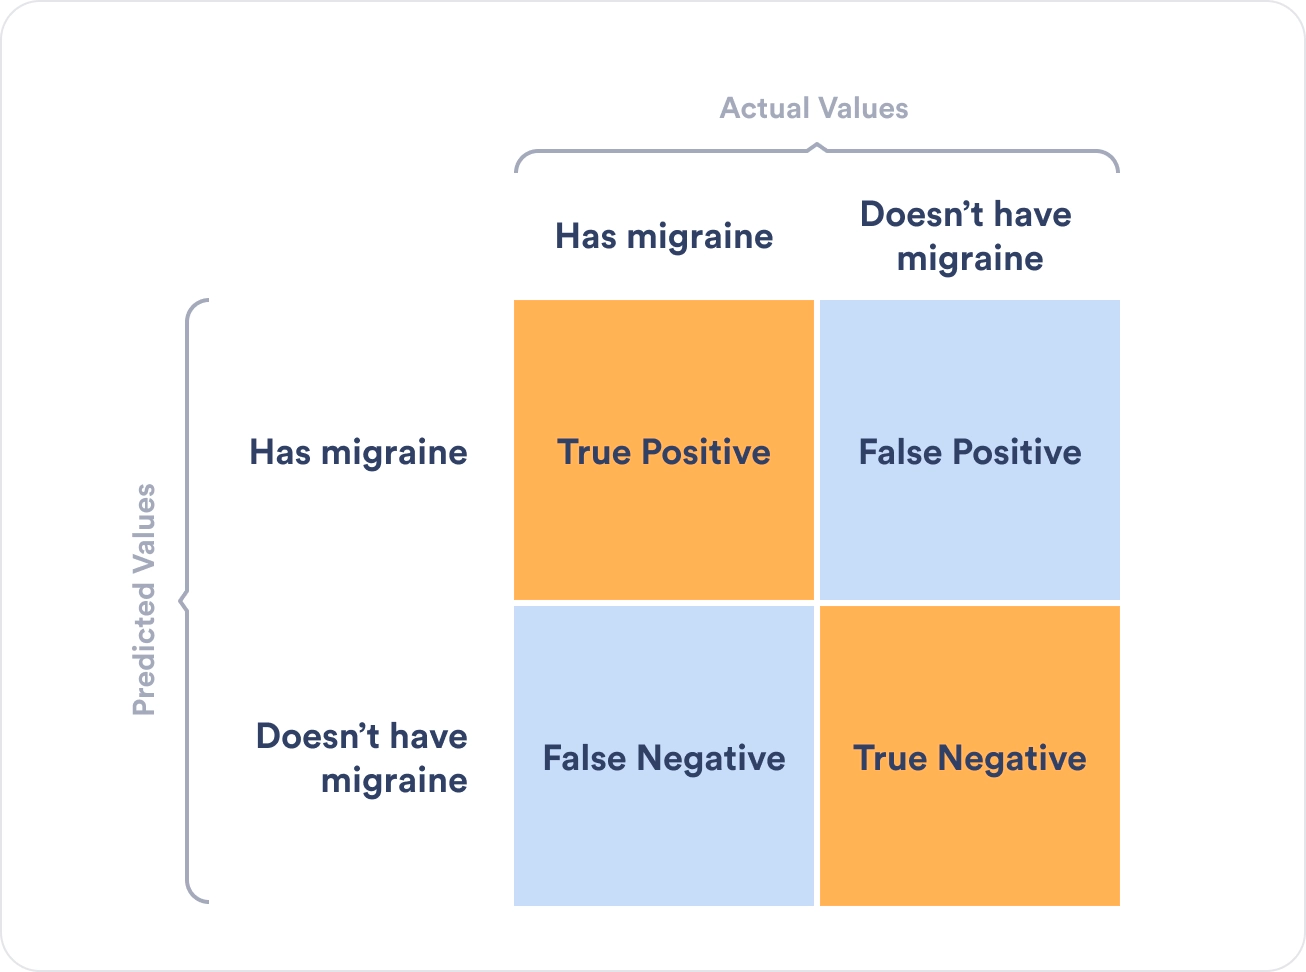
In classification models, we use the confusion matrix.
From this matrix, precision and recall are derived. Precision measures the accuracy of positive predictions.
The recall measure the model's ability to capture all positive instances.
The F1 score, a harmonic mean of precision and recall, offers a balanced assessment of the model's performance.
F1 score closer to 1 is better, and you need both precision and recall high to achieve that.
Performance is Context Dependent
The context of user and the business is quite relevant in assessing the performance. PMs play a pivotal role in contextualizing these metrics within the broader business framework and determining the deployability of models to end-users.
In conclusion, a comprehensive understanding of performance measurement in supervised machine learning models is important for PMs. By mastering these concepts, PMs can effectively collaborate with data scientists, make informed decisions, and contribute to the successful deployment of AI products.
Stay tuned for our exploration of unsupervised models in the next post/ video :)
Resharing the video of me explaining this in-depth 👇
Thank you for reading this edition of the newsletter ✨
If you found it interesting, you will also love my

