👋 Hey, I am Deepak, and welcome to another edition of my newsletter. I am writing a series on Mastering the Product Interviews. The first post can be found here.
Before we start, I'd like to make a quick announcement!
The applications for the next live cohort of the Advanced Growth Program are open now. It's a unique learning experience via custom learning software and live classes. About 300+ experienced PMs have gone through the program and loved it.
The first atomic bomb exploded at 5:30 AM on July 16, 1945, in the New Mexico desert of the USA. Shortly afterward, Enrico Fermi estimated its explosive yield with a simple calculation while sitting 10 miles away in a camp.
He made the estimate on the spot, using the technique that now bears his name: Fermi estimation. Here is the official account for it.
About 40 seconds after the explosion the air blast reached me. I tried to estimate its strength by dropping from about six feet small pieces of paper before, during, and after the passage of the blast wave. Since, at the time, there was no wind I could observe very distinctly and actually measure the displacement of the pieces of paper that were in the process of falling while the blast was passing. The shift was about 2 1/2 meters, which, at the time, I estimated to correspond to the blast that would be produced by 10,000 tons of TNT.
—Enrico Fermi, Top Secret interview July 16, 1945, declassified in 1965
So, how off was he? The blast's official estimate, which came weeks later, was 21,000 tons of TNT. Fermi's estimate was quite accurate, given that he was sitting 10 miles away in a camp. He was just off by a factor of 2 when we didn't know much about atomic bombs. That's impressive. How did he do it?
The trick in the Fermi’s estimate is to estimate values using only orders of magnitude, a.k.a. powers of ten. For example, if we have to place a bet on the number of cars in India per person, we have to choose in the orders of magnitude, i.e. between 0.1, 1, or 10, 100..etc.
My pick while doing this exercise was 0.10, and the actual number is 0.05 (70 million registered 4-wheelers and above, assume 50-70% of it as number of cars).
But don’t the errors add up and throw out a ridiculous number as an output when you perform complex calculations? It may feel that the final calculation would be far away from the actual number, and yet when we apply it, it actually works.
Let’s try a question built for Fermi estimation: How many petrol pumps are there in Mumbai? You can’t answer “I don’t know” :)
Let’s try Fermi estimation (picking a multiple of 10)
There are 10 million people in Mumbai (by the rule of “only powers-of-ten,” our pick is 10 million; the other two options are 1 million and 100 million. The actual number in Mumbai happens to be 20 million).
In Mumbai, there are more vehicles per person owing to the wealth the city accumulates. So between 0.1 and 1, we will pick 1 car per person.
A vehicle refills one time per month (it’s not 0.1 and not 10).
A petrol pumps handles 10000 refills per month (the number is not 1000 or 100000. You can do a quick calculation based on our observations in day-to-day life. Each time I have gone to a petrol pump, there are 10 vehicles there getting serviced within the span of 15 mins I am there (not 1 or 100). That leads to 40 cars refilled per hour, and with 12 operational hours per day, we have 480 refills per day. That translates to around 15000 refills per month. Since this number is closer to 10,000, we pick that number).
With 10 million refills per month (10 million vehicles with 1 refill per month), divided by 10000 refills per petrol pump, we would need 1,000 petrol pumps in Mumbai.
A source says that there are 1162 petrol pumps in Mumbai!
Despite being inaccurate in the process, the end result of 1000 petrol pumps is indeed closer to the actual number of 1162. That’s the power of Fermi Estimation.
If a scientist can use quick, fun estimations in one of the most prolific events in human history, we can too when there is a need on the job!
The Job of a PM and Guesstimates
The job of a product manager is filled with uncertainties, and these uncertainties come in all shapes and sizes.
Imagine that you are a product manager at an e-commerce startup, and in a meeting, the CEO asks for your input on whether the company should go into Women's Workwear. You do a quick Google search, but since it’s a niche market, you don’t get much data around it. You find a couple of sources. The global workwear market is estimated at $32 billion, but you don’t find much data around India. After looking around more, you get another option — to purchase a report around the workwear market at $2900. But with limited info around the topic, you don’t know whether to buy an expensive report and trust it.
So what do you do? You employ your mental faculties to do a quick estimation of what could be a reasonable number so that it’s easy to move forward with a decision. You further have to calculate it from different approaches and triangulate it to a decent number. And that’s what is expected of you as a PM.
Intelligent estimation skills are useful in other places as well. It can help in
estimating effort and timelines for features on the roadmap, and
estimating the user or business impact that a feature can have
As you get better at doing these estimations on the job, you also get better at guesstimates, and vice-versa.
Solving Guesstimates in Product Interviews
In the last post, we covered how the real job PM skills actually help in building your advantage in PM interviews. In this post, we talk about how to solve the estimation questions that come frequently in PM interviews.
There is enough literature written about guesstimates, so how is this post going to be different? I wanted this post to become a one-stop guide to guesstimates so that you don't have to read anything else. How do you do that? The simple answer is cover everything. But that is just lazy.
To become a one stop guide, merely covering everything under the sun isn't going to cut it. The framework/ approach has to be so fundamental that everything else can be derived from it. Not to mention, it also has to be clear and easy to understand so that everyone reading it can actually apply it.
We have already answered why companies ask guesstimates by looking at how guesstimates are useful in a PM job.
The guide covers:
Companies that love this question
Popular interview questions of this type
Generally suggested approach or framework to solve such questions
An end-to-end example of the approach
Handy numbers for solving guesstimates
What a better approach to solving such questions look like
Key mistakes and examples of such mistakes
Test your knowledge of this topic (beginner vs advanced score)
Subjective Questions Database for further practice
Books, articles and videos around the topic
This post was getting way longer to cover all of it. So, in this post, we cover points 1-5. We would deep dive into 6-10 into the next week’s post. Subscribe to the newsletter so that you don’t miss it!
Let’s start!
1. Companies that Love Guesstimates
This interview problem is relevant to startups as well as mature companies because, as we mentioned, it is quite relevant to certain skills in the PM job.
Estimation questions are pretty common in product manager interviews at companies like Google, Facebook, and Amazon. Owing to the simplicity of these questions, these questions also get asked in startups.
2. Popular Interview Questions
Here are a few common examples of PM estimation interview questions to provide a better sense. Even if all of these questions are categorised as guesstimates, there are various sub-types that we will cover later and how to approach them. For now, read through them so that you have a good sense of various types of questions:
- What is the market size for driverless cars in 2025?
- What is the storage space required to host all images on Google Street View?
- What is the required Internet bandwidth for an average college campus?
- How many kindergarten teachers are there in the US?
- What is the weight of a school bus?
- Estimate the number of ATMs in India
- Estimate the number of videos on Youtube
- Estimate the market size of self-driving cars
- How many dentists are there in New York?
- How many queries does Gmail get per second?
- How many airplanes are in the air right now in India?
- Estimate the cost of storing Google Photos on the Photos app.
3. Generally Suggested Approach or Framework to Solve This Question with Example
Let’s take an example where you are sitting in a Product interview and the interviewer asks you to estimate the number of YouTube videos watched in India in a single day.
How would you address this question? Below is the recommended method for solving guesstimate problems.
Clarify the question
Pick an approach
Calculate using the approach
Sense check your results to make sure your calculations are accurate, and the final number doesn’t look improbable
Let’s apply it to understand this method better!
Clarification
Like any product interview, clarifying questions make sure you don’t make wrong assumptions and are on the wrong track to solve the problem. Here are a few important clarification questions you would need to ask:
Should we count just the long-form videos or shorts as well?
Interviewer: Assume that we have to long form videos
What should qualify a video as ‘watched’? Is it >1s, >10s, or >30 s?
Interviewer: Take >30 s as watched
There are long ad videos on YouTube as well, which most of the people skip. Should we exclude them?
Interviewer: Yes, please exclude them
Approach
There are several approaches you can take to arrive at the number.
You can take the total population and multiply it by the average number of videos watched per person per day.
You can estimate the total number of videos and multiply it by views per video per day.
You can also take the total number of smartphones and smart TVs and multiply it by the average number of videos watched per smart device
The golden rule in picking up an approach is — pick an approach where you can derive the numbers easily when you break it down further.
Let’s critique these approaches. For example, let’s take approach #2. Views per video per day is hard to derive. Further, a total number of YouTube videos is also hard to come by as it is an accumulating number. So, approach #2 isn’t recommended.
You can pick #1 or #3 and arrive at a number.
Here is a step-by-step calculation that you need to do if you pick approach #1:
Calculate the number of people with smartphone and smart tv access
Calculate the average time spent per user per day on Youtube
Calculate the average length of a video watched (this is a function of average length of video and % completion)
You can draw an issue tree to break down these calculations further. Going down to 3 levels in the issue tree covers enough details while not making the guesstimates overly complex.
Calculate
The next step is to put the numbers in the issue tree and back-calculate.
When making these assumptions, it is vital that you pick simple numbers. For instance, you should use 350 days in a year instead of 365. You should assume that the average cost per product is $3.00 instead of $2.50. Rounding numbers will make your calculations easier and decrease your likelihood of making a mistake.
The issue tree above can be updated as below. Note that while making numerical assumptions, we use handy numbers for solving guesstimates. These numbers are shared at the end of this post, so don’t worry if some of these numbers seem too intelligent a guess. After going through the handy numbers section, you would be able to make the same assumptions.
We take the assumption that 30% of the population can afford a smartphone. This number is one the basis of per capita income in India, where median income is around $100 per month, and top 10% have $300 per month. A person earning more than $100 can afford a smartphone, but as it happen in middle class family, there is just one bread winner (usually husband). And so the # of smartphones per household is 2 in such families. That’s why we take 30% of population owning smartphones — (10% top income) + (next 40% divided by 2)
Next, we make the assumption that kids population (0-10 years) is around 20% of population because India has young demographics. Further, parents control their consumption, so consumption is lower (30 mins per day). We make assumptions in a similar way as we go through other number. For example, we make an assumptions of 2 hours/ day for retired people because they have lots of time to have fun after retirement :)
We take average length of video watched as 10 mins because most of the long-form videos are also music, recipes, news snippets, etc. which are shorter than 10 mins. We take average % of video watched before existing as 70% because people leave the videos in between even if they have crossed the >30 s threshold. Please note that this number would have been different if the threshold had been different.
Next, we can calculate from right to left and get
20% of 400 million watches 3/0.7 videos a day
50% of 400 million watches 6/0.7 videos a day
30% of 400 million watches 12/0.7 videos a day
The final number comes out to be 4.1 billion videos per day.
Sanity Check
Most candidates stop talking at the end of step three. They look up and expect their interviewer to tell them if they got to the right result or not. Don’t do that. The best candidates sense-check their results and try to spot their own mistakes before telling their interviewer they are done.
Let’s try to sense check the results.
We have take 400 million Youtube users in India which doesn’t seem far off.
The average time spent per user is >1 hour daily. This is a number we need to relook. While the power users of Youtube may spend this much time, not everyone spends 1 hour on Youtube daily. People also spend a lot of their time in listening to music, watching short videos platform (including shorts on Youtube which we have excluded), and on OTT platforms watching shows and movies.
So we can cut the number by 50% per day per user.
Further, assuming that Youtube shorts will have 20% of watch time, we can take the final number as 0.8*0.5 = 40%
We have taken the average length of long-form videos to be 10 mins, which seems right.
So the final number can be 40%* 4.1 billion = 1.6 billion videos a day.
If you are looking to see how off we are from actual numbers, YouTube users view 1 billion hours of video each day. That accounts for around 5 billion YouTube videos being watched each day. India accounts for 10% of Youtube traffic, so by that account, the share of videos watched could be anywhere between 0.5-0.7 billion. So we are off by a factor of 2, but not much.
Thank you Mr. Fermi! :)
5. Handy Numbers for Solving Guesstimates
If you are interviewing for an Indian company, make sure you have handy numbers for guesstimates. Having these numbers handy makes you sound intelligent in interviews, and also provides you a way to anchor and perform sanity check.
If you are interviewing for a global company, make sure to have basic number of US and the world handy, along with India.
Top 10 numbers you should have handy:
Total world population = 7.3 billion
World smartphone users = 4 billion
Population of India = 1.3 billion
Urban vs. Rural split in India = 30% urban, 70% rural
Households in India = 325 million
Smartphone users in India = 600 million
Internet penetration in India = 50% = 625 million
US population = 330 million
Mumbai population = 20 million, NYC population = 8 million
Average household size in India = 4, US = 3
Beyond these, age groups and income levels are pretty important as they determine the behaviour of people.
INDIA
Age — India has a younger demographic with a median age of 27 years.
0-15 : 25%
15-64: 65%
65+: 10%
Income
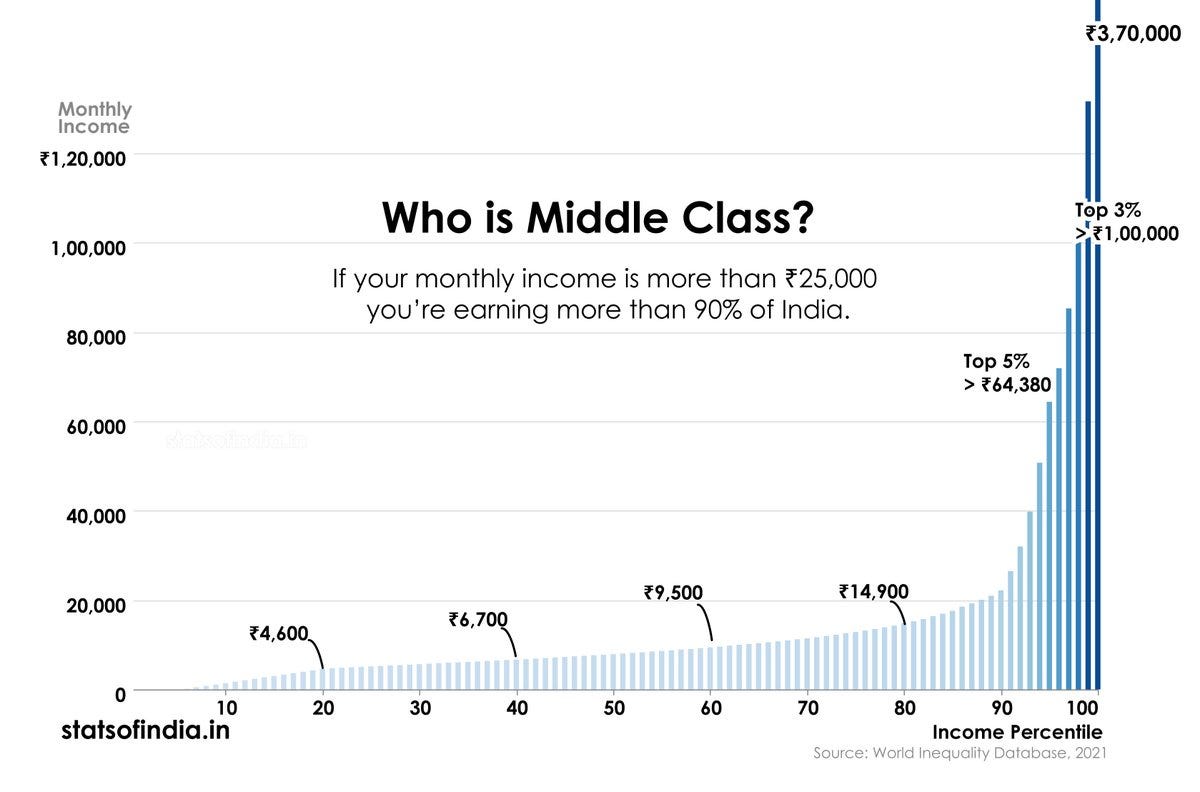
As a rule of thumb, you can remember that top 10% makes INR 25000 per month, or $300 per month. Top 5% makes >$800 per month, and top 3% makes > $1200 per month. That means the number of people making >$1000 per month would be around 3%*1.2 billion = 36 million. This is also, btw, the number of credit card holders in India (4%).
To look at the 600 million smartphone users, we have to look at 50th percentile. The median income is ~ $100 per month.
USA
Age is balanced
0-15 : 17%
15-64: 65%
65+: 18%
Income distribution
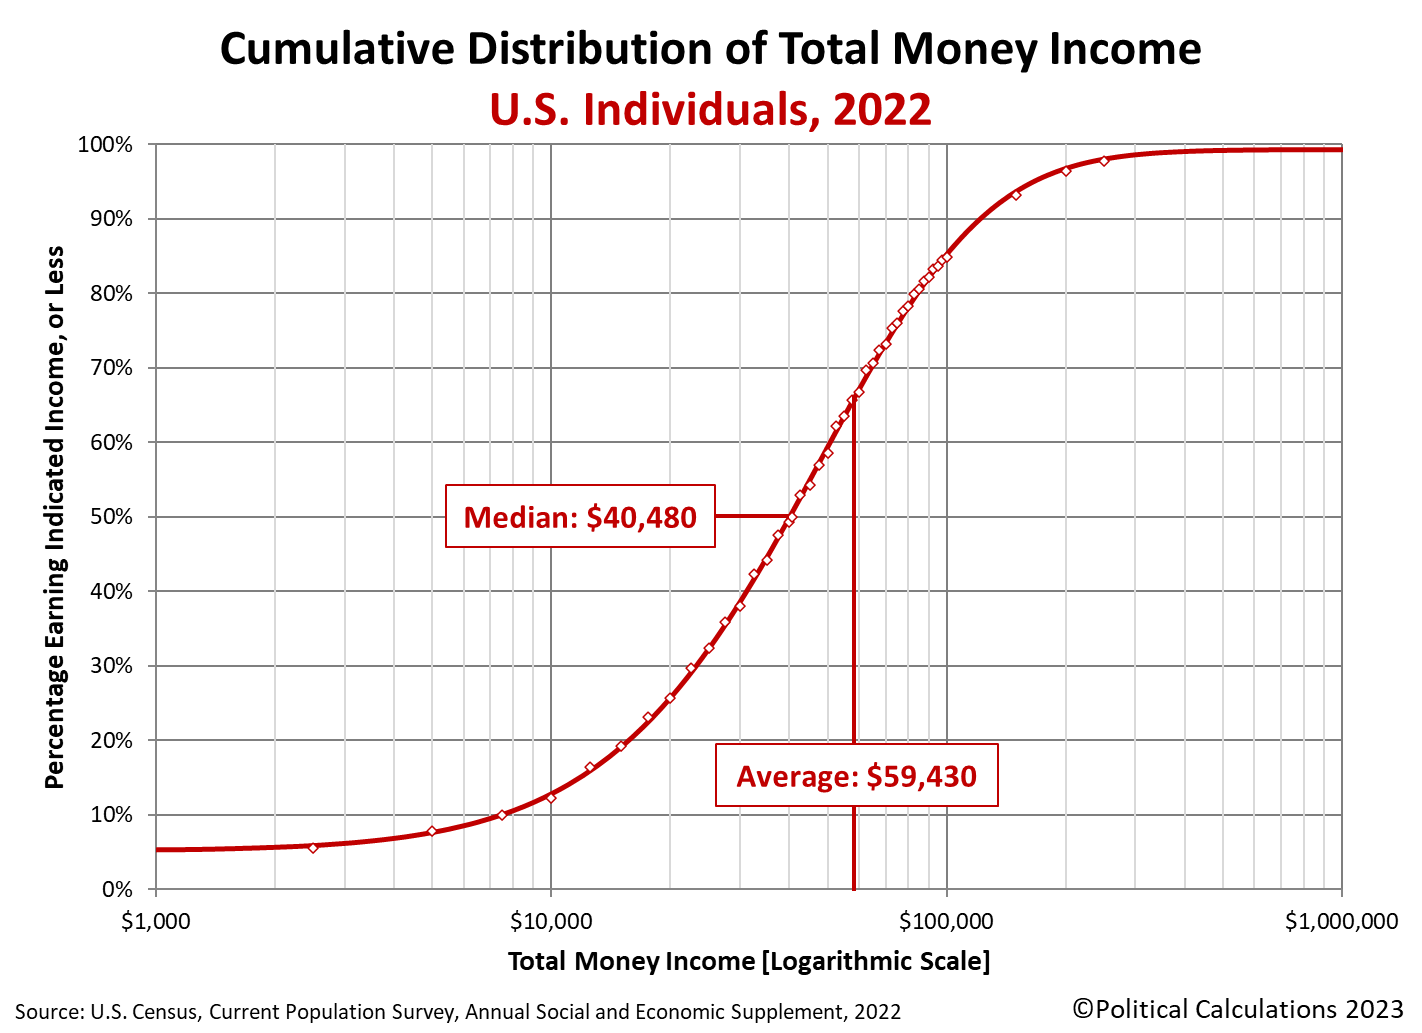
For USA, the median income is around $40 k, whereas top 10% is >$100 k.
You should note at this point that household income distribution is different than individual incomes since multiple people can be earners in a household.
World
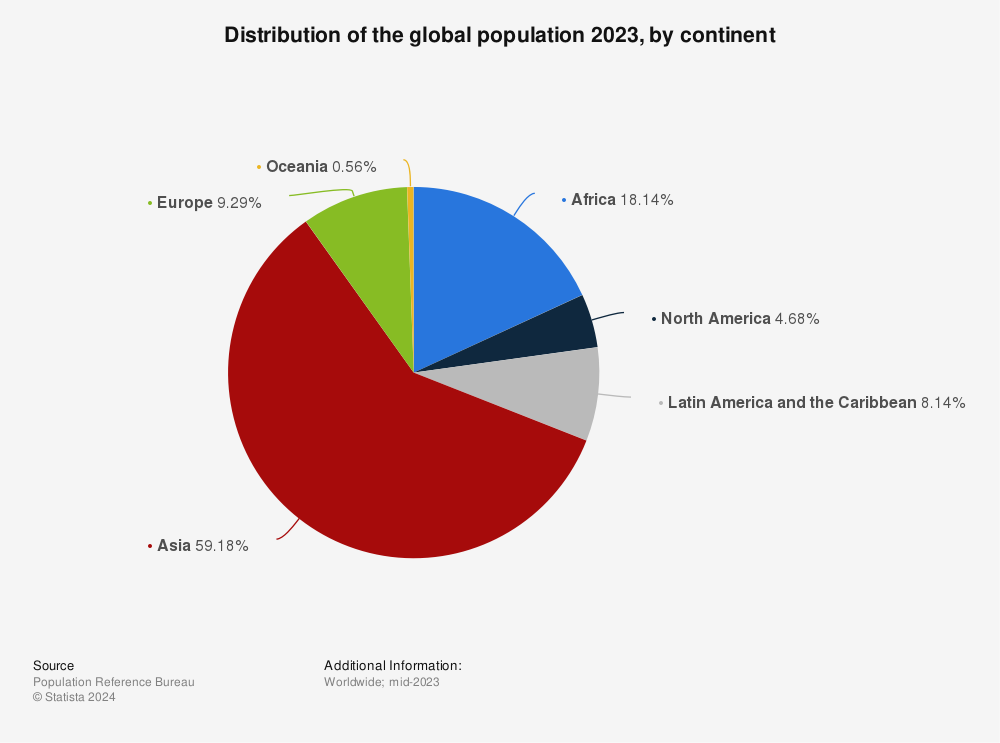
Where people live
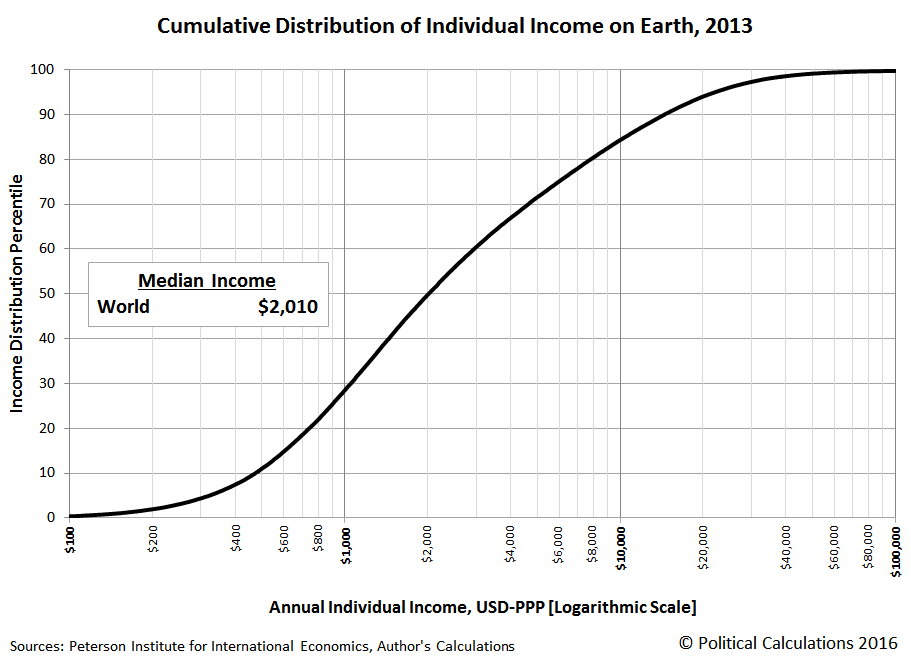
How much do they earn
What’s Next!
In the next week’s post, we cover how a better approach to solve guesstimates involved identifying sub-types of questions (volumetric, population, consumption, product), and why a different approach should be picked to solve each of them.
Further, we also go into the complex problems such as market sizing and their examples.
See you next week,
Deepak


